The beginning of 2026 once again highlights a fundamental rule of crypto markets: not all assets move at the same pace.
While certain narratives dominate attention — artificial intelligence, decentralized infrastructure, or modular blockchains — the performance of different projects diverges significantly.
Since January, several major crypto assets have followed very different trajectories. Some are showing relative resilience despite the broader market correction, while others have experienced sharper declines.
To better visualize these dynamics, we simulated a simple portfolio composed of several representative crypto assets. The goal is to observe how each asset evolves in the crypto race of 2026, and which projects are actually outperforming the market.
Methodology
To analyze this trend, we built a simple portfolio composed of eight crypto assets representing different segments of the market:
BTC, ETH, ATOM, AKT, OSMO, AVAX, ALGO and TAO.
The simulation follows a straightforward rule:
- $1000 invested in each asset
- purchase date: January 3rd, 2026
- observation date: mid-March 2026
This approach allows us to compare how each asset evolves over the same time frame.
Current Performance Ranking
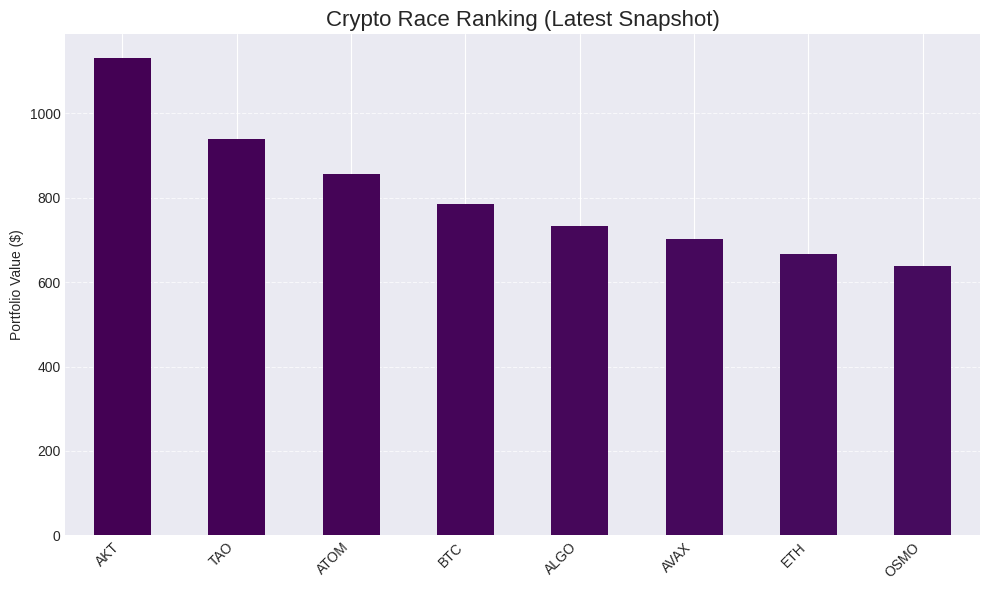
The chart below shows the current value of the portfolio for each crypto asset.
(Insert chart: Crypto Race Ranking)
Even within a declining market environment, the differences between assets are quite visible.
AKT stands out as the strongest performer in this simulation, with a value above the initial investment.
TAO and ATOM show relative resilience, while several other altcoins experienced deeper corrections.
Overall Portfolio Performance
Initial investment:
$8000
Current portfolio value:
$6434
Overall performance:
-19.6%
This decline reflects the broader market correction observed since the start of the year.
Relative Performance vs Bitcoin
The second chart offers another perspective by measuring the relative performance of each asset compared to Bitcoin.
(Insert chart: Relative Performance vs Bitcoin)
The horizontal line represents Bitcoin’s performance.
Assets above this line outperform BTC, while assets below it underperform the market benchmark.
Several interesting patterns emerge:
- AKT shows strong relative outperformance
- ATOM experienced a strong outperformance phase earlier in the period
- TAO remains slightly above Bitcoin overall
- ETH and OSMO underperform BTC during this timeframe
This type of analysis helps highlight sector rotations and shifts in market attention.

What About Staking?
While the primary goal of this analysis is to compare asset performance, it is also useful to briefly examine the potential impact of staking.
For assets supporting staking, we applied commonly observed network yields:
| Asset | Estimated APR |
|---|---|
| AKT | 12% |
| ALGO | 5% |
| ATOM | 15% |
| AVAX | 7% |
| BTC | 0% |
| ETH | 4% |
| OSMO | 20% |
| TAO | 7% |
Over the observed period (roughly 70 days), staking slightly increases the portfolio value.
Portfolio value with staking:
$6543
Performance with staking:
-18.2%
The impact remains relatively modest over a short period, but it illustrates how staking can partially reduce volatility over longer investment horizons.
Conclusion
The first months of 2026 once again demonstrate how diverse the crypto market can be.
Certain projects tied to infrastructure or AI narratives appear more resilient, while several altcoins have experienced deeper corrections.
In this environment, staking does not fundamentally change market direction, but it can act as a complementary mechanism that slightly improves long-term portfolio resilience.
The crypto race of 2026 is still unfolding, and the coming months will reveal which projects truly manage to outperform the market.