Introduction
The cryptocurrency market operates in a complex environment where identifying trends and objectively evaluating projects pose significant challenges for investors. To address this issue, Snow-Fall.io has developed an innovative crypto scoring system, combining technical analysis and fundamental data to offer a structured view of the market.
This analysis presents our proprietary methodology and examines the impact of the June 2024 results on current cryptocurrency market dynamics.
Scoring System Methodology
Analytical Foundations
Our system is based on a multidimensional approach incorporating four fundamental criteria, each weighted according to its strategic importance:
| Criterion | Weight | Analytical Objective |
|---|---|---|
| Market Capitalization | 35% | Assess project solidity and maturity |
| 24h Trading Volume | 25% | Measure liquidity and market interest |
| Weekly Performance | 25% | Reflect recent value creation |
| Technical Momentum | 15% | Identify predictive potential and trends |
Weighting Justification
Market capitalization (35%) is our primary criterion as it reflects market confidence and project stability. Trading volume (25%) and weekly performance (25%) are equally weighted, balancing liquidity and dynamism. Technical momentum (15%) complements the analysis by providing a predictive perspective.
Comparative Analysis by Categories
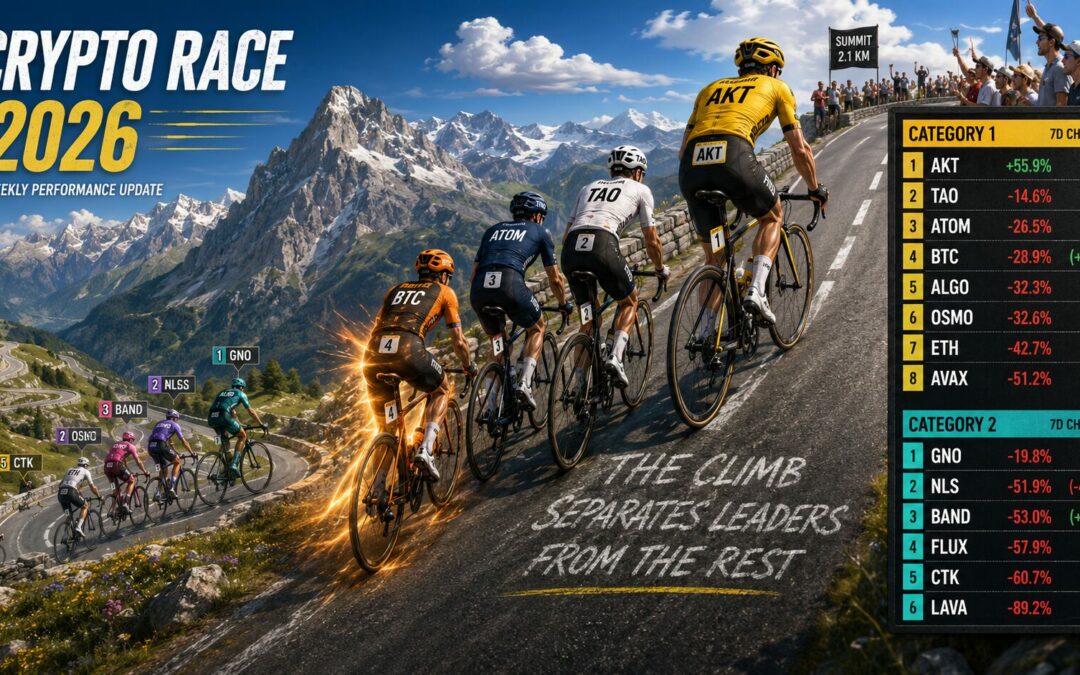
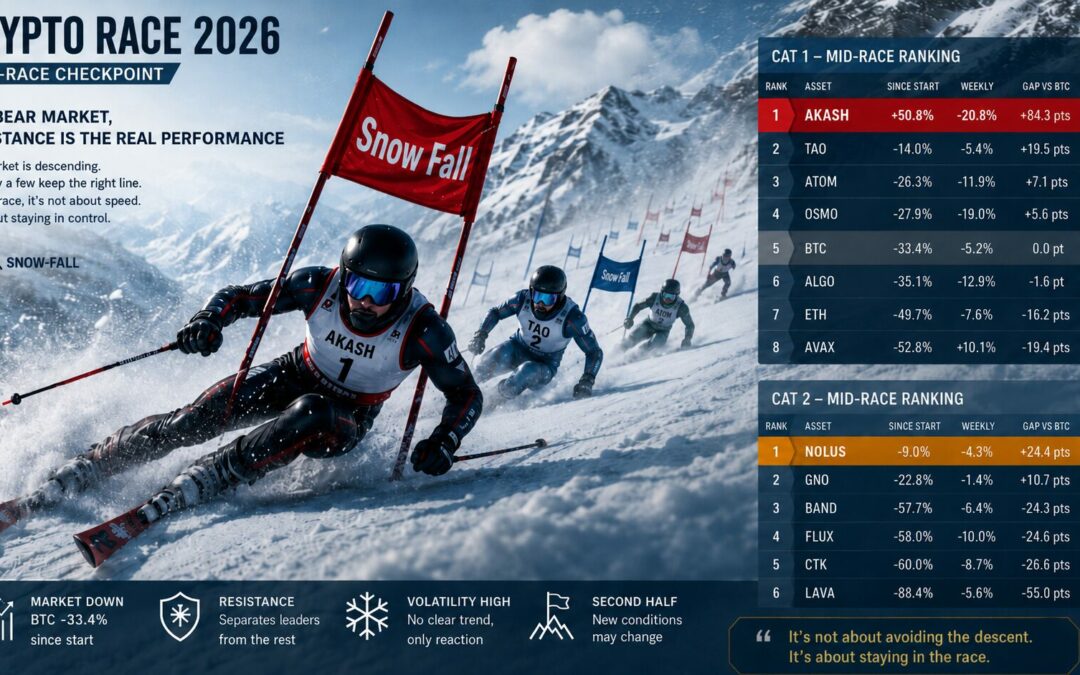
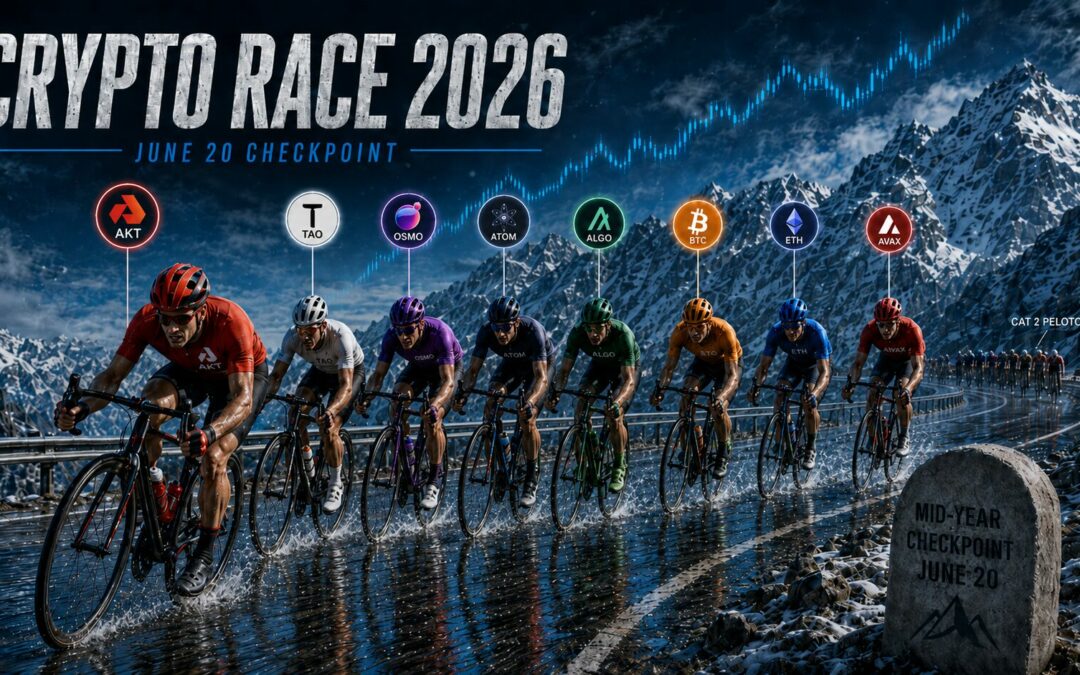
Category 1: Established Projects (Large Cap)
These assets represent the maturity of the crypto market with significant capitalization and institutional recognition.
June 2024 Results:
- Bitcoin (BTC): 39.7/50 (79.4%) - Confirmed dominance
- Ethereum (ETH): 37.1/50 (74.2%) - Strong performance
- Avalanche (AVAX): 26.5/50 (53.0%) - Relative stability
- Algorand (ALGO): 21.7/50 (43.4%) - Moderate performance
- Horizen (ZEN): 17.2/50 (34.4%) - Underperformance
Strategic Analysis:
The traditional hierarchy is maintained, with Bitcoin and Ethereum retaining their leadership. This stability reflects the increasing maturity of the market and institutional confidence.
Category 2: Intermediate Projects (Mid Cap)
This category presents the optimal balance between innovation and stability, with projects in a growth phase.
Notable Performances:
- TAO (Bittensor): 40.3/50 (80.6%) - Exceptional outperformance
- OM (Mantra): 35.3/50 (70.6%) - Strong dynamics
- BAND Protocol: 32.0/50 (64.0%) - Sustained growth
- BABY (Babylon): 28.9/50 (57.8%) - Significant progress
- FLUX: 24.8/50 (49.6%) - Balanced performance
Projects in Consolidation:
- CTK (Shentu): 22.1/50 (44.2%)
- AGORIC: 19.5/50 (39.0%)
- STARGAZE: 16.8/50 (33.6%)
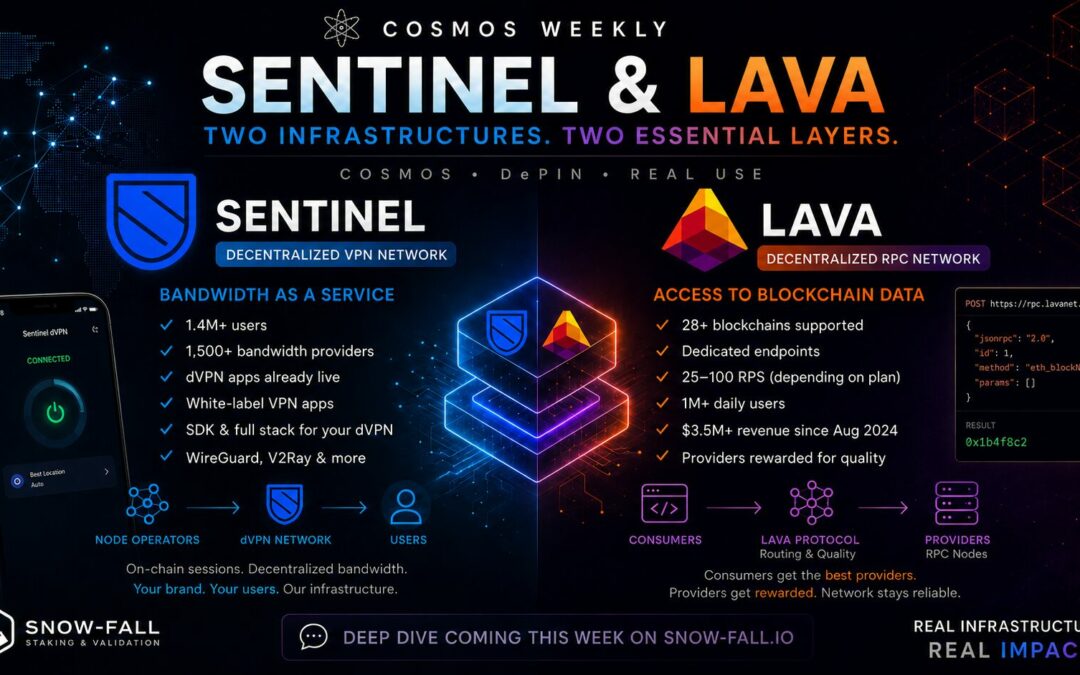
- SENTINEL: 14.2/50 (28.4%)
- CAPS: 12.5/50 (25.0%)
Category 3: Emerging Projects (Small Cap)
These projects represent innovation and growth potential, with high volatility characteristic of early stages.
Detailed Results:
- AURA: 21.8/50 (43.6%) - Category leadership
- NIBIRU: 19.7/50 (39.4%) - Confirmed potential
- NEOXA: 18.5/50 (37.0%) - Encouraging progress
- KYVE: 17.2/50 (34.4%) - Relative stability
- ELYS: 16.9/50 (33.8%) - Balanced performance
Projects in Development:
- LAVA: 15.8/50 (31.6%)
- WATER: 15.2/50 (30.4%)
- MEDIBLOC: 14.8/50 (29.6%)
- GRAVITYBRIDGE: 13.7/50 (27.4%)
- ASSETMANTLE: 12.3/50 (24.6%)
- XKI: 11.9/50 (23.8%)
Strategic Insights and Implications
Observed Trends
Stability of Leaders: Bitcoin and Ethereum maintain their dominance with scores above 70%, confirming their role as market benchmarks.
Emergence of New Players: TAO (Bittensor) stands out with a score of 80.6%, even surpassing some established projects, demonstrating continuous innovation in the ecosystem.
Controlled Volatility: Emerging projects show moderate scores (23.8% to 43.6%), indicating a gradual maturation of the market.
Identified Correlations
- Volume vs. Performance: Positive correlation between trading volume and weekly performance.
- Capitalization vs. Stability: Projects with high capitalization exhibit less volatility.
- Innovation vs. Momentum: Innovative projects (TAO, OM) benefit from high technical momentum.
Implications for Investors
Defensive Strategy: Favor Bitcoin and Ethereum for portfolio stability and resilience.
Growth Strategy: Consider TAO, OM, and BAND Protocol for balanced growth potential.
Speculative Strategy: Explore AURA, NIBIRU, and NEOXA for exposure to emerging projects.
Time Evolution and Perspectives
Comparative Analysis: June 2024 vs. Current Period
The reconstruction of June 2024 data reveals persistent trends:
- Consolidation of Leaders: Bitcoin and Ethereum strengthen their position.
- Maturation of Mid-Caps: General improvement in scores within this category.
- Natural Selection: Performance concentration on the most solid projects.
Influencing Factors
Macroeconomic Context: June 2024 market conditions favored stability and selective investments.
Institutional Adoption: Acceleration of adoption by traditional financial institutions.
Technological Innovation: Emergence of new decentralized applications and artificial intelligence in blockchain.
Continuous Optimization Methodology
Weighting Calibration
Our system undergoes regular adjustments based on:
- Evolving market conditions
- Historical performance feedback
- Integration of new indicators
Results Validation
Three-step validation process:
- Backtesting on historical data
- Comparative analysis with benchmark indices
- Cross-validation with other methodologies
Limitations and Considerations
Methodological Limitations
- Data Dependence: Quality of results linked to data source reliability.
- Inherent Volatility: The crypto market remains intrinsically volatile.
- Time Bias: Past performance does not guarantee future results.
Usage Recommendations
- Use scoring as a decision-making tool, not as a buy/sell signal.
- Combine with other analyses (fundamental, market sentiment).
- Maintain an appropriate risk management approach.
Conclusion
Snow-Fall.io’s crypto scoring system offers a structured and analytical approach to navigate the complexity of the cryptocurrency market. The June 2024 results confirm the relevance of our methodology and reveal significant trends: consolidation of leaders, emergence of new innovative players, and gradual maturation of the ecosystem.
This three-dimensional analysis, combining real-time, historical, and multi-category data, is a valuable tool for identifying investment opportunities and anticipating market developments. The continuous evolution of our methodology ensures its adaptation to the changing dynamics of the blockchain ecosystem.
Disclaimer: This analysis is provided for informational purposes only and does not constitute investment advice. Past performance is not indicative of future results. It is recommended to consult a financial advisor before making any investment decisions.